Delivering Higher Service Quality via the Amber QA Dashboard
The MIT Center for Digital Business professors Andrew McAfee and Erik Brynjolfsson explained in a 2011 Wall Street Journal article that data-driven companies had 4% higher productivity and 6% higher profits than the average. So, the best time to invest in reporting is now!
The games industry is no different, maybe even more reliant on data interpretation from the beginning of a project to the end of its life-cycle. What makes it more complex is the quantification of subjective impressions, what people like or dislike, how a certain element or bug can be perceived by the public, or the ever-elusive concept of “fun”.
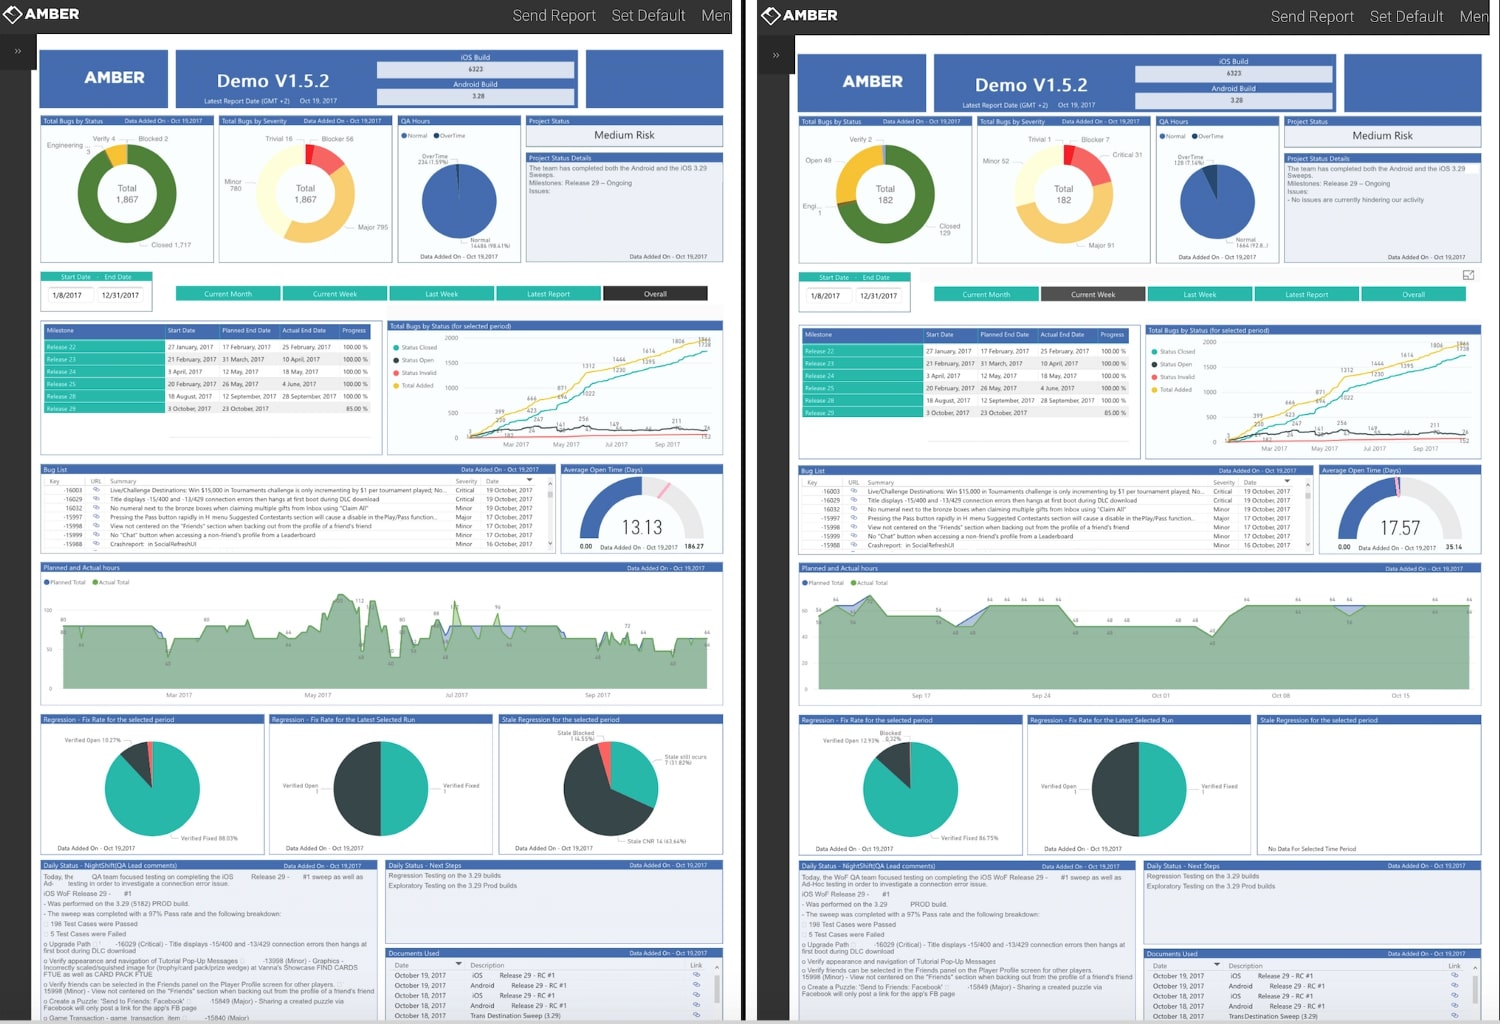
At Amber we put a lot of emphasis on all aspects of reporting such as what data to be collected, how this data is collected, how it is analyzed, and how are conclusions derived to support the decision-making process. As a result, our internally developed tool, the Amber Dashboard, is an integrated reporting system that offers real-time visibility over the main project metrics, with a fast and easy way to filter and analyze data for any specific period or milestone of the project.

50% More KPIs Tracked & Reported: Creating and implementing the Dashboard in the agency's internal QA group in 2017 had an immediate positive return in terms of what data can be tracked and assembled to generate automatically an extra 50% of the core KPIs — the ones that would normally be prohibitive to track and assemble into reports via manual means, yet are essential to having a complete picture of the state of a project. Examples of such metrics include the average open time by bug type or by bug severity, bug fix rates for custom periods, and these are still not too complex until we add extra variables such as the build versions with respective changes to the game to have an even better picture of where we need to focus our attention. The right indicators also have a positive impact in the collaboration and communication between teams, as all parties involved are referencing the same sets of data, follow and understand the analysis, and confidence is building up organically when seeing positive results.
31% Less Reporting Time: Replacing manual actions in gathering data based on automated integration with various databases resulted in significantly reducing the reporting time, while increasing the number of data points, making more room for data analysis and invaluable conclusions. The productivity of the teams increased while covering a much larger amount of data in less time, reducing turnaround in making decisions, course correct and channel the effort on areas with higher risks as it happened on 45% of our projects keeping these projects on time and on budget with high quality.

80% Less Requests for Additional Information: Another huge win for both QA team and partners is the reduction of additional data reporting and interpretation. Access to older reports or filtering by milestone is now one click away. So, all the hassle with the e-mail requests, pending responses, putting spreadsheets together then answering questions, things that any QA team must deal with, is now history for Amber QA. We analyze the few requests coming in as well as industry trends to set a high standard in our reporting system. This significant decrease in additional reporting requests ties in with the number of people challenging the source of the data, the way it is collected and interpreted. Furthermore, less challenges on the data itself had an impact on the morale of the team which is no longer stressed for the accuracy of the information or holding difficult conversations with partners.
12% Increase in Partner Satisfaction: We consider critical to receive periodic feedback on our work and reporting is an essential point on the list. In the past 12 months, the rating has increased by 12%, reaching 87% satisfaction with partners and going over 80% target satisfaction in 2017. This is a result of greater accountability and increased scrutiny in our teams based on reliable data, transparency and analysis capabilities put to work.
With this success we continued to improve our reporting system, polish what we have, as well as adding key new features to support data driven decision-making process. The 2018 Amber Dashboard will also include, besides standard QA project reports, customization of templates and graphs based on set KPIs, long-term project forecasting of QA resources, improved back-end with SQL database and billing module to help Project Managers keep a better tracking of the costs associated with QA.
Here are the best practices we recommend our partners:
- Define the baseline metrics and the role they play in the decision-making process from both a project/operational standpoint, as well as the business perspective. Please ensure they are the right indicators, they are traceable in either manual or automated fashion, and can be disseminated within the teams.
- Define optimum standard reporting including templates and the most appropriate and suitable reporting tool. We decided to go with internal development to easily customize our needs and our clients requirements.
- Make sure there are integration capabilities with other tools and databases in use and leave room for customization and further updates. One should not limit the approach to current state and known information. Go to next level, think big data.
- Set the process and the framework covering data gathering, tracking, data analysis and communication. Keep a continuous improvement approach.
- Have a long-term strategy that covers data management, reporting and analysis delivery and the understanding of future needs and trends. Connect simpler KPIs to the bigger picture, for example how QA-related KPIs on the project correlate with other disciplines performance indicators and identify patterns.